C & C++
Learn C & C++, the foundation of modern programming, to develop efficient software, system applications, and problem-solving skills using structured and object-oriented programming concepts.
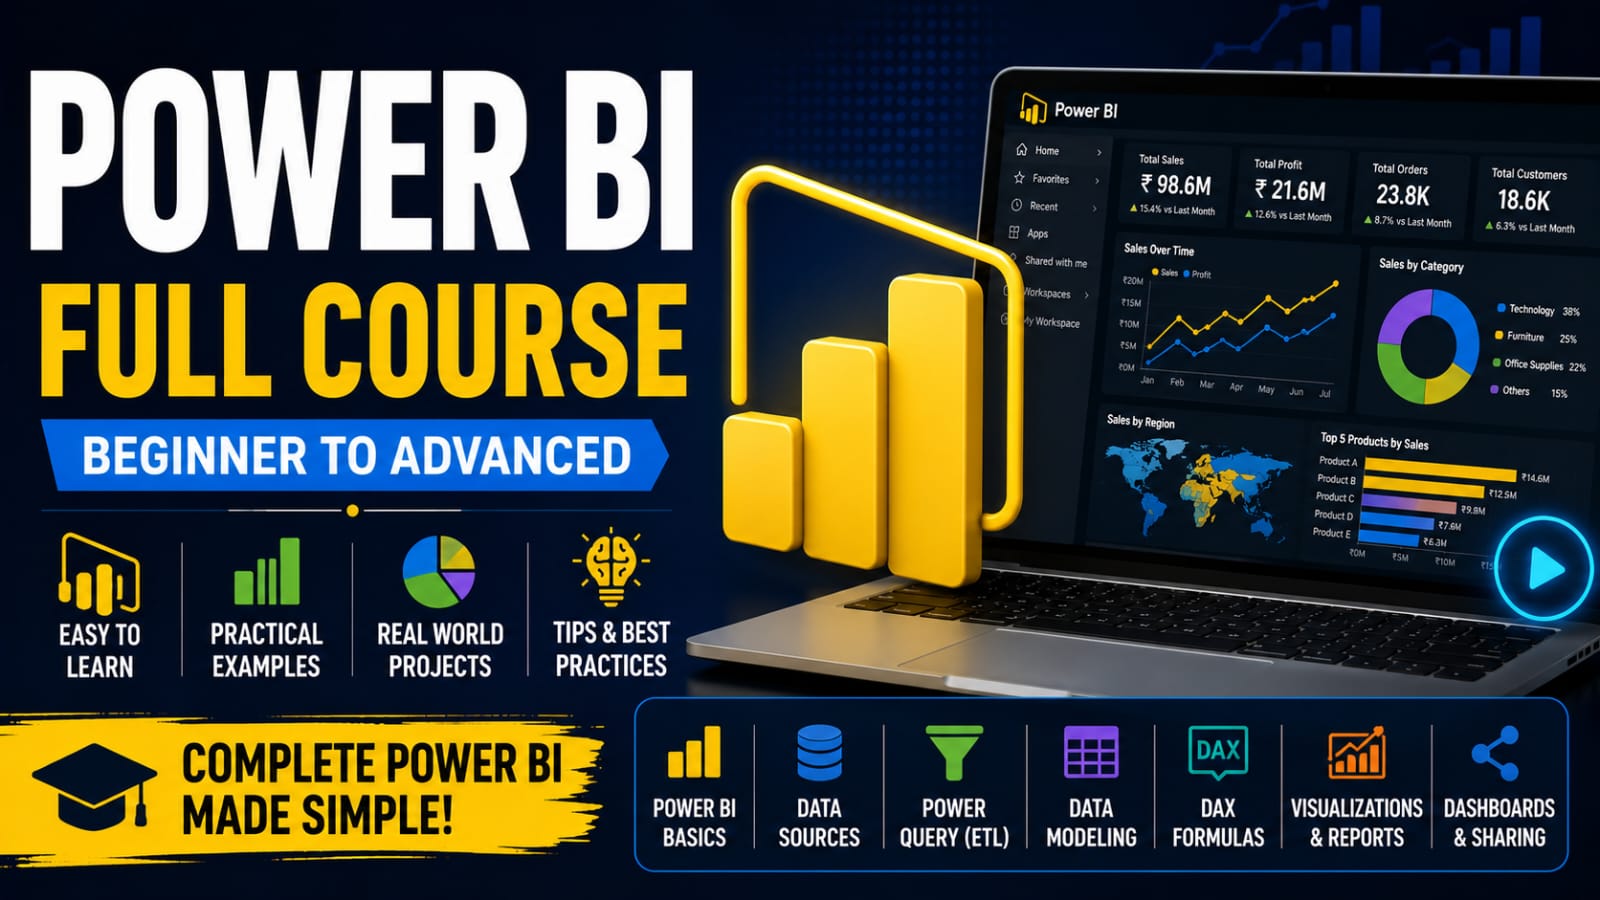
View CourseLearn Microsoft Power BI to transform raw data into interactive dashboards, insightful reports, and business intelligence solutions for informed decision-making.
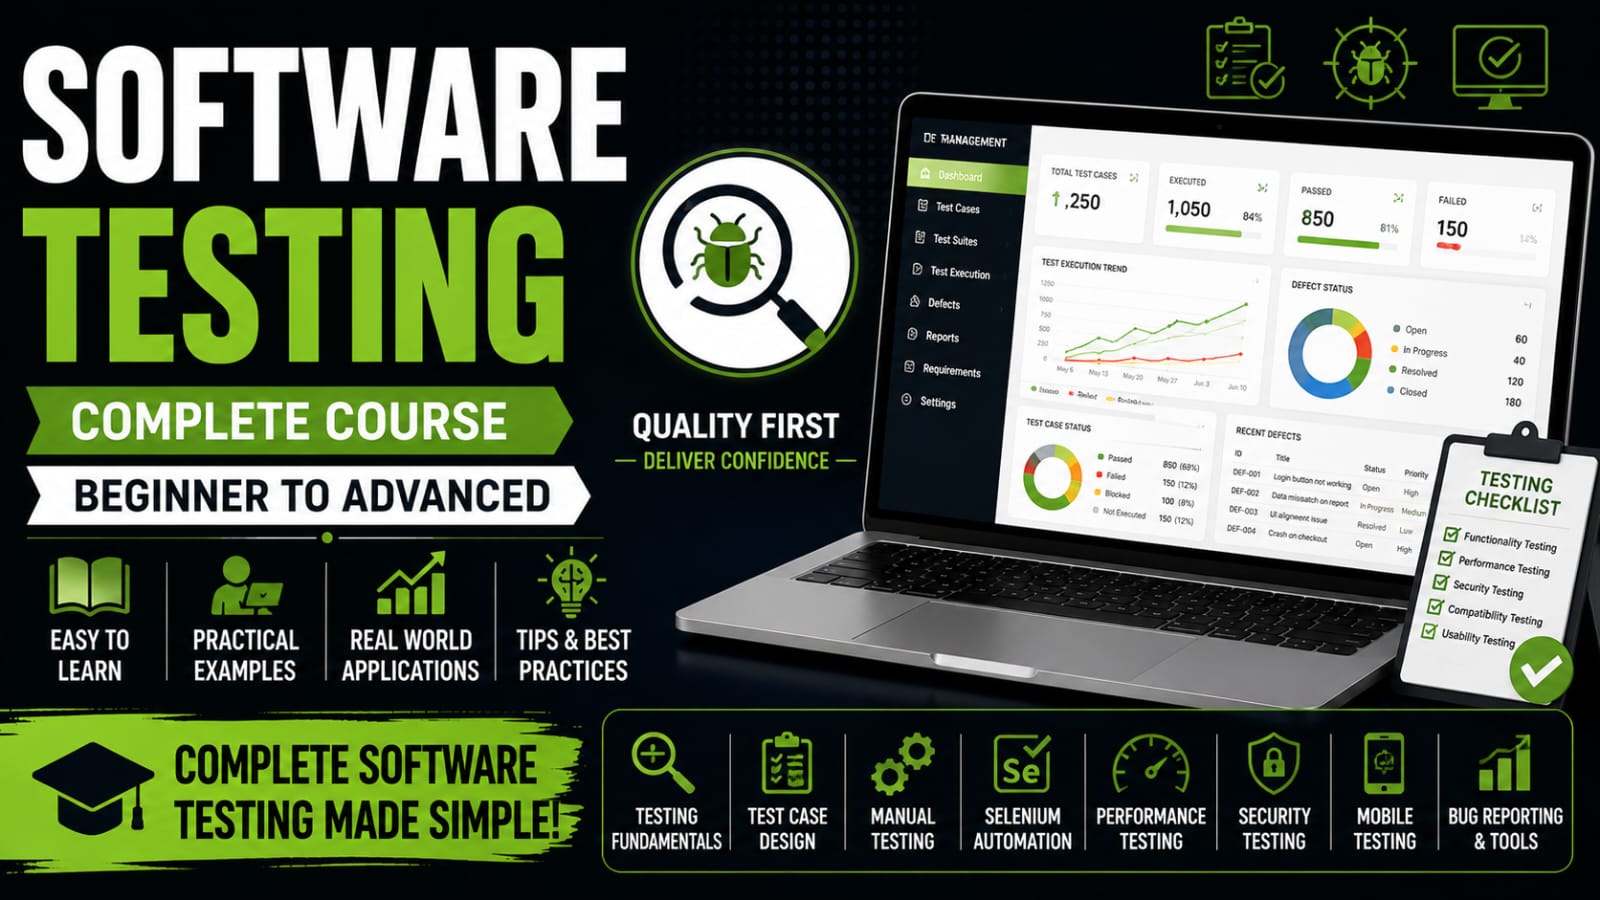
The Microsoft Power BI course is designed for students, professionals, business analysts, and aspiring data analysts who want to master business intelligence and data visualization. The course covers Power BI fundamentals, data importing, data cleaning and transformation with Power Query, data modeling, DAX (Data Analysis Expressions), interactive dashboards, charts, reports, KPIs, filters, slicers, and report publishing using the Power BI Service. Participants will gain hands-on experience by working with real-world datasets to analyze business performance, identify trends, and create visually compelling reports. The course also introduces data connectivity with Excel, SQL, MySQL, and cloud-based data sources, along with report sharing, collaboration, and security features. By the end of the course, learners will have the practical skills and confidence to build professional business intelligence solutions and support data-driven decision-making across various industries.
Understand Power BI, its purpose, its components, and how businesses use it to analyze data and make decisions. Topics: What is Power BI, features and benefits, Power BI Desktop, Power BI Service, Power BI Mobile, installation, workspace overview, and first report.
Lessons will be added soon.
Learn to import data from different sources and understand how Power BI connects to business information. Topics: Excel, CSV, text files, folders, databases, web sources, Import vs DirectQuery, data refresh basics, and connection troubleshooting.
Lessons will be added soon.
Prepare raw data for analysis by correcting errors, cleaning values, and transforming tables. Topics: Power Query Editor, data types, removing duplicates, handling nulls, replacing values, splitting and merging columns, pivot and unpivot, append, merge queries, and applied steps.
Lessons will be added soon.
Organize tables and create relationships so that reports calculate and filter data correctly. Topics: Tables, primary and foreign keys, relationship types, cardinality, filter direction, fact and dimension tables, star schema, date tables, and model optimization basics.
Lessons will be added soon.
Learn Data Analysis Expressions (DAX), the formula language used to create calculations in Power BI. Topics: Measures, calculated columns, calculated tables, SUM, AVERAGE, COUNTROWS, DISTINCTCOUNT, IF, DIVIDE, variables, and basic filter context.
Lessons will be added soon.
Create business calculations, comparisons, percentages, and time-based performance measures. Topics: CALCULATE, FILTER, ALL, REMOVEFILTERS, iterator functions such as SUMX, row context, filter context, context transition, date intelligence, year-to-date, month-over-month, year-over-year, and running totals.
Lessons will be added soon.
Choose appropriate visuals to communicate insights clearly and accurately. Topics: Bar and column charts, line charts, pie and donut charts, tables, matrices, cards, KPI visuals, maps, combo charts, conditional formatting, tooltips, and visual interactions.
Lessons will be added soon.
Build interactive, professional reports that allow users to explore data and discover trends. Topics: Slicers, filters, drill-down, drill-through, bookmarks, buttons, page navigation, report tooltips, dynamic titles, themes, layout, accessibility, and storytelling with data.
Lessons will be added soon.
Publish reports online and learn how teams access, refresh, and share business insights. Topics: Publishing from Desktop, workspaces, reports vs dashboards, semantic models, scheduled refresh, sharing, apps, permissions, gateways, and licensing basics.
Lessons will be added soon.
Improve report performance, manage data access, and understand advanced Power BI capabilities. Topics: Row-level security (RLS), role testing, performance analyzer, model size, reducing unnecessary columns, DAX optimization basics, incremental refresh concepts, deployment pipelines overview, and troubleshooting.
Lessons will be added soon.
Apply the concepts learned to business scenarios and build complete reports using realistic datasets. Topics: Sales analysis dashboard, financial performance report, HR analytics, inventory analysis, customer analysis, KPI creation, data cleaning, DAX measures, and presenting insights.
Lessons will be added soon.
Complete an end-to-end Power BI project and demonstrate the ability to explain technical decisions and business findings. Topics: Final project development, data preparation, modeling, DAX, interactive report design, publishing, project documentation, portfolio presentation, common Power BI interview questions, practical exercises, and project evaluation.
Lessons will be added soon.
Learn C & C++, the foundation of modern programming, to develop efficient software, system applications, and problem-solving skills using structured and object-oriented programming concepts.
View CourseLearn Software Testing with hands-on training in manual testing, automation testing, test case design, bug reporting, API testing, and quality assurance to deliver reliable software applications.
View CourseLearn Python, a versatile and beginner-friendly programming language, to develop web applications, automate tasks, analyze data, and build AI, machine learning, and data science solutions.
View Course